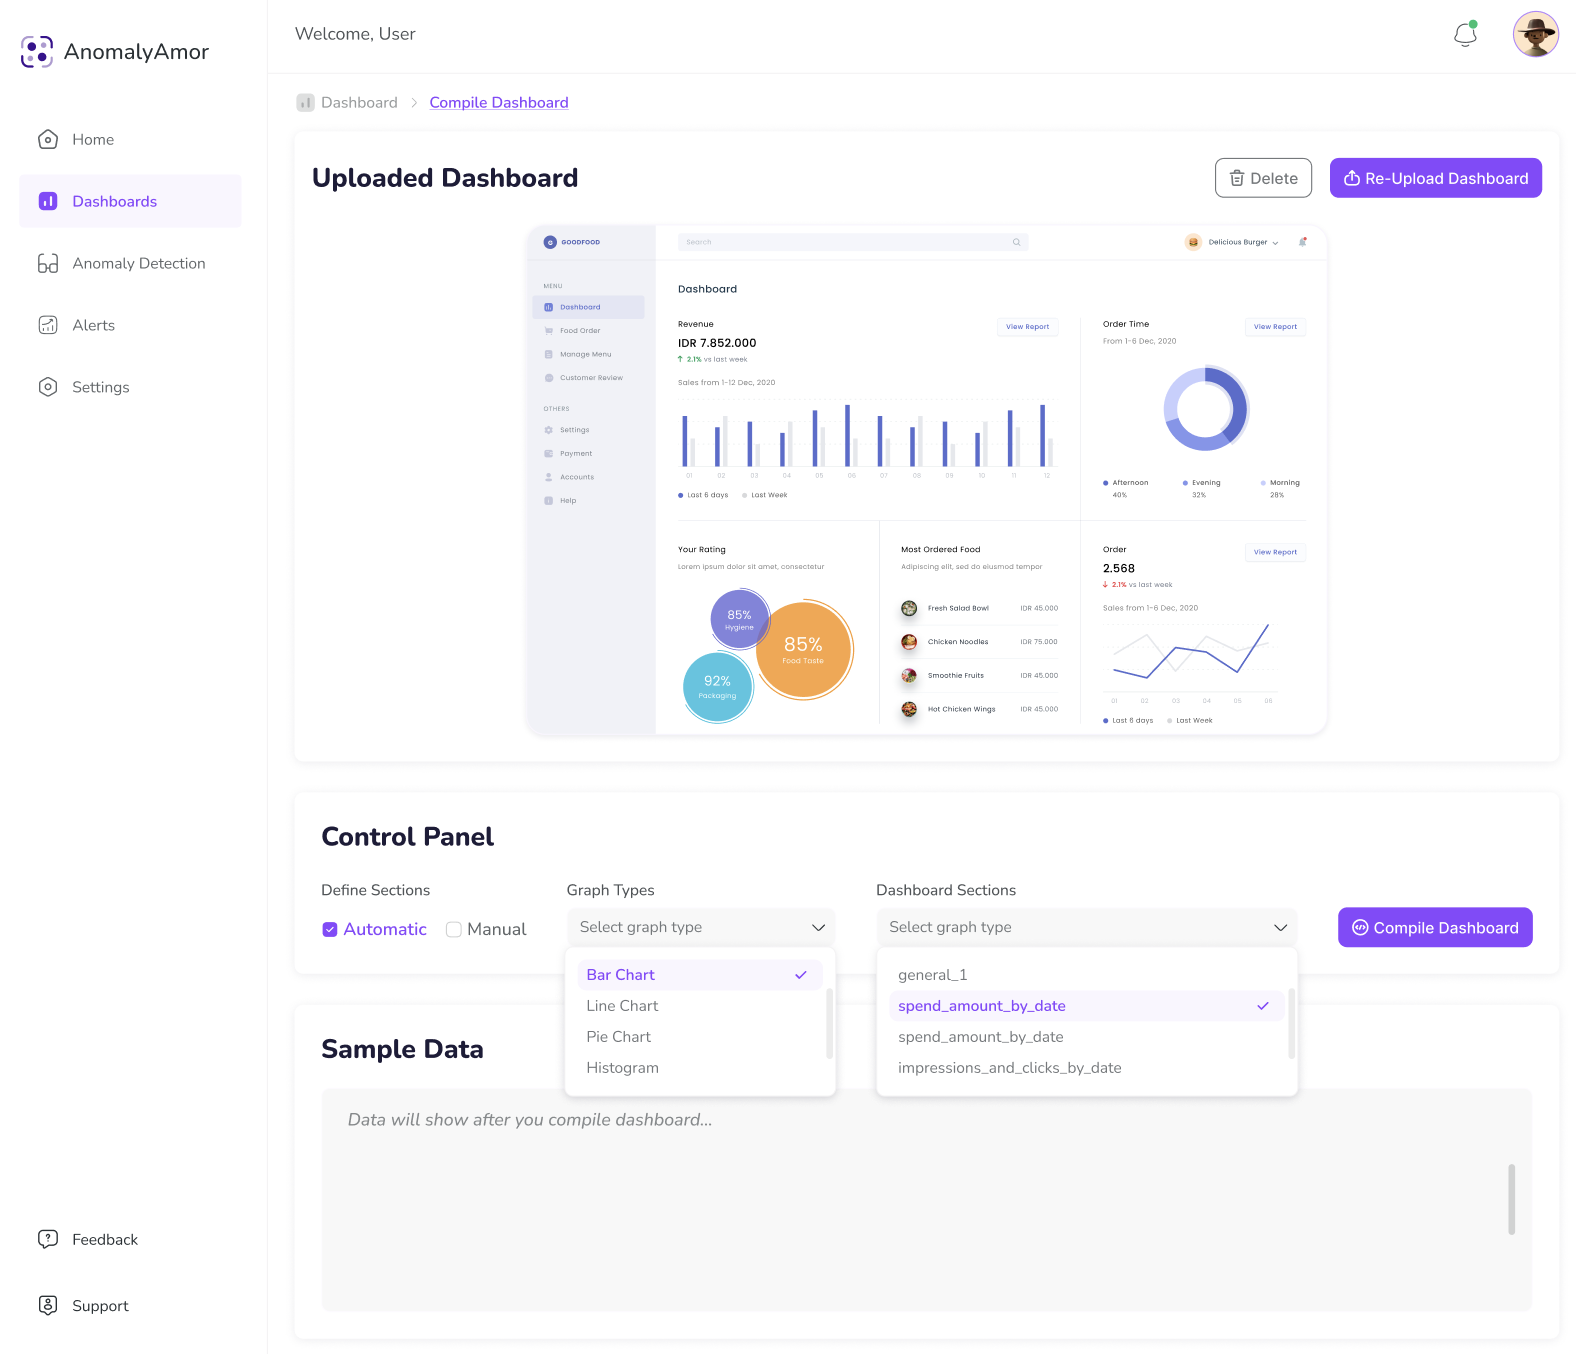
Building Confidence in your Dashboards
For the Executive
Does my quarterly report contain any abnormal data? What major changes to my sales dashboard should I be aware of?
For the Analyst
Why was there a surge in orders? When was my customer attribution data last updated?
For the Engineer
What recent changes were applied to my tables? By how much did my data grow last month?

Features
Dashboard Integration
Connects seamlessly with BI tools like Databricks. Enables direct data access and analysis from current dashboards, eliminating manual imports/exports and reducing inconsistencies.
Dashboard Diff Visualization
Compares dashboard versions side-by-side, highlighting changes in charts and data points. Quickly identifies and explains modifications in complex dashboards.
Abnormal Data Detection
Automatically detects data anomalies using advanced algorithms. Notifies users of unexpected patterns, enabling quick responses to emerging trends or potential issues.
Historical Data Tracking
Maintains a timeline of all dashboard changes, including historical data modifications. Provides a complete audit trail, safeguarding data integrity and supporting trend analysis.
Multi-Modal Access
Offers an intuitive interface for both technical and non-technical users. Reduces learning curve, encourages adoption, and enables efficient use across departments.
Change Summarization
Condenses complex dashboard changes into concise, easy-to-understand summaries. Extracts key modifications, supporting faster decision-making and insight generation.
Our industry expertise and solutions
Get Started
Launch the AnomalyArmor console to start monitoring your systems for anomalies